SELF-TAPE STUDIO / ORIGINAL RESEARCH
The figures behind the story
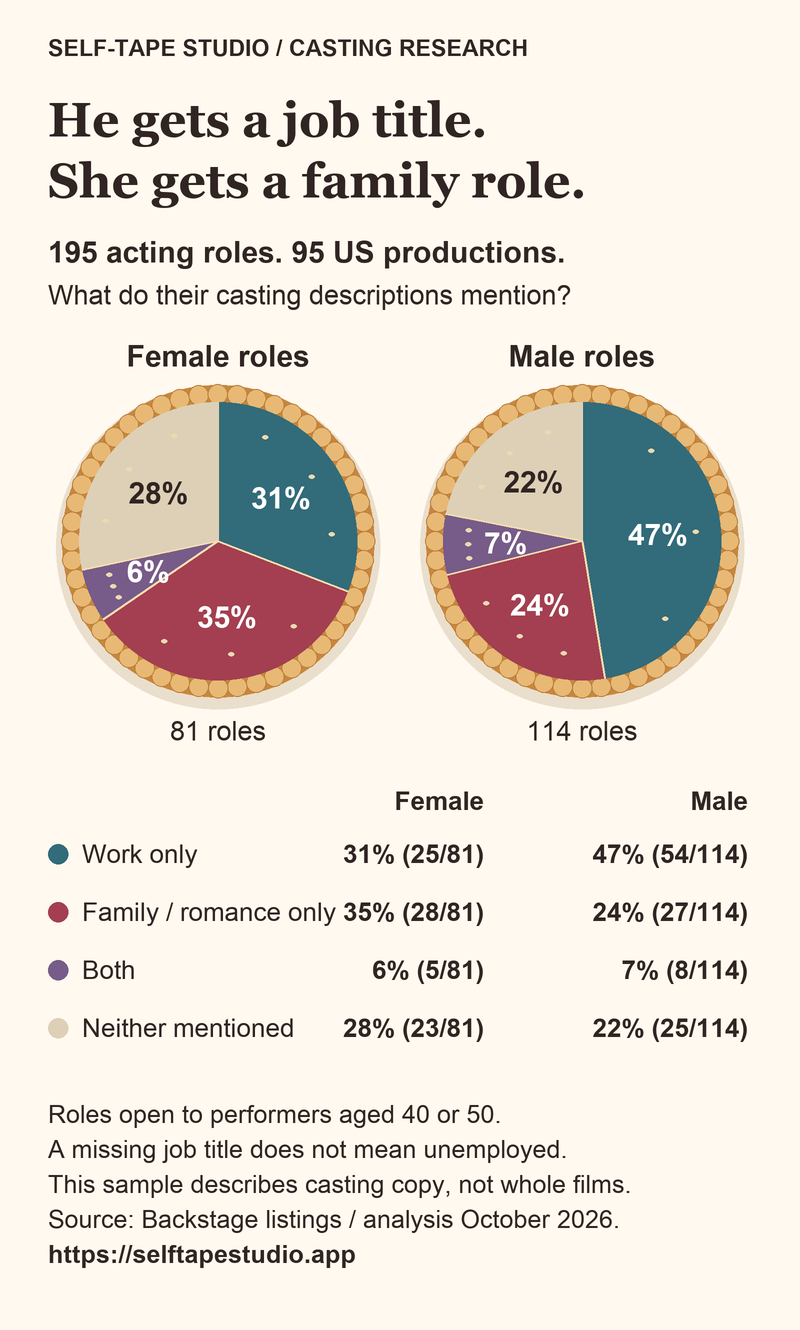
The article compares 195 roles across 95 US productions: 81 listed as female and 114 listed as male.
We checked whether each casting description mentioned a current occupation, a family or romantic relationship, both, or neither. Every role belongs to exactly one category below.
| Category | Female roles (81) | Male roles (114) |
|---|---|---|
| Work only | 25 / 81 (30.9%) | 54 / 114 (47.4%) |
| Family / romance only | 28 / 81 (34.6%) | 27 / 114 (23.7%) |
| Both | 5 / 81 (6.2%) | 8 / 114 (7.0%) |
| Neither mentioned | 23 / 81 (28.4%) | 25 / 114 (21.9%) |
Each cell shows the number of roles, the total for that gender and the percentage. The article and infographic round percentages to whole numbers. The pies have equal areas to compare proportions, not sample sizes.
Open or save the full-size infographic
What counts?
- Work only
- An explicit current occupation, with no family or romantic relationship mentioned.
- Family / romance only
- An explicit relative, spouse, ex-partner or romantic relationship, with no current occupation mentioned.
- Both
- The description mentions both an occupation and a family or romantic relationship.
- Neither mentioned
- Neither is explicit in the description. The character may still have a job, a family or a partner in the script.
Work includes criminal occupations. Former or aspiring jobs and unpaid family care do not count as current occupations. Friendships and professional relationships do not count as family or romance. We used each role's description and directly identifying project context, without borrowing details from another character's description.
How the roles were selected
These 195 roles are the complete second batch of a wider Backstage review, covering result pages 26 to 50. They are not an additional sample on top of that review. Analysis was completed by October 1, 2026.
Eligible roles came from US narrative productions advertised as paid, including rates to be confirmed. They were adult lead, supporting or day-player roles with finite casting age ranges below 99 that included 40 or 50. These are performers' requested age ranges, not exact character ages.
We excluded student projects, advertising, documentary and real-person casting, crew, background, stand-in and voiceover-only roles. Gender follows the listing's Female/Male field.
Did the pattern survive other checks?
Yes. A comparison within 34 productions advertising eligible roles for both genders, giving each production equal weight, still found more work-only descriptions for men and more relationship-only descriptions for women.
One listing had a gender field that conflicted with its description. Reassigning it preserved the main pattern. It did reverse the tiny difference in the category mentioning both work and relationships, so we do not treat that difference as a finding.
This is a nonrandom snapshot of one casting platform. Advertised roles are not complete casts. Missing information is not proof that a character lacks a career or family. These figures cannot establish discrimination or describe all films or finished performances.
Earlier research: the larger sample and age comparisons
The wider review covered 364 distinct roles across 164 production clusters from 50 results pages. It checked occupations. The 195 roles used in the article are part of those 364, reread specifically for relationships. The table below belongs to that larger occupation review and is not the denominator for the article's pies.
| Eligible at age | Gender | Current work / all roles | Care or education / working roles |
|---|---|---|---|
| 40 | Female | 51 / 125 (40.8%) | 13 / 51 (25.5%) |
| 40 | Male | 114 / 179 (63.7%) | 7 / 114 (6.1%) |
| 50 | Female | 35 / 84 (41.7%) | 13 / 35 (37.1%) |
| 50 | Male | 108 / 168 (64.3%) | 8 / 108 (7.4%) |
The 40 and 50 groups overlap; do not add them together. Care or education includes healthcare, education and residential/social care. Those percentages use working roles as their denominator. Small counts, especially for female working roles, limit conclusions. These comparisons do not show a widening work gap with age.
Examples cited in the article
- Crazy Zenzot’s Big Bang: the police captain, professor, officer, sergeant and Elena examples.
- Overview: the radiologist, astronaut and NASA administrator examples.